Sunday, December 5, 2010

Standardized choropleth map

http://personal.uncc.edu/lagaro/cwg/color/color_symbol.html
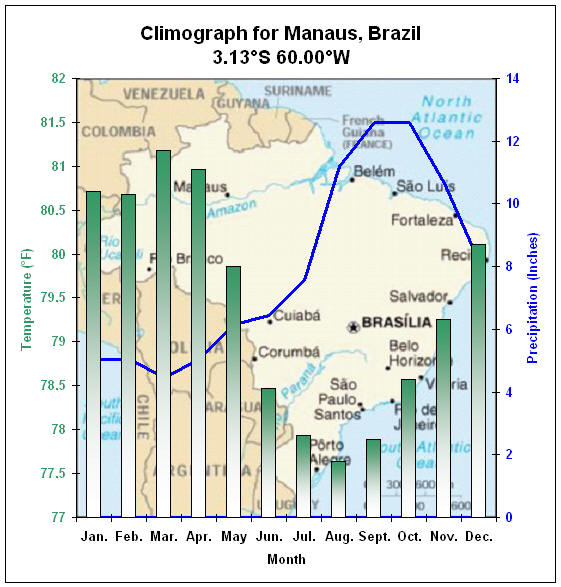
A standardized choropleth map averages the data presented areally to a specific unit. This particular map shows the expenditure per pupil of the public education system of North Carolina, divided by county. An unstandardized map would present a far different picture, being skewed by counties with exceptionally large or small populations. This type of map presents this type of data more accurately than an unstandardized choropleth map would.

Unstandardized choropleth map

http://en.wikipedia.org/wiki/File:Choropleth.gif
An unstandardized choropleth map is one where the data is not areally averaged. This particular map shows the average water use by state of the entire US. This data might be misleading for some viewers who do not understand that the data is not averaged by population, which would create a far different map.

Univariate choropleth map

http://www.agcensus.usda.gov/Publications/2002/Ag_Atlas_Maps/Crops_and_Plants/index.asp
A univariate choropleth map such as this one overlays a single set of data onto the base map. Here we see acres of corn harvested for grain across the US. The use of six groupings for data points makes the map relatively easy to decipher.

Bivariate choropleth

http://www.cartogrammar.com/blog/indiemapper-is-here/
A bivariate choropleth map uses two sets of data, or variables, to color one map based on their correlation. This map, from a site discussing a mapmaking program, shows on the top left a set of data points based on two variables. States are colored based on where the two variables converge in the graph, and thus show the convergence of both variables.

Pie chart

http://vi.sualize.us/view/9edf745d25f9d0b5286f3d980a715686/
This is a pie chart, which, outside of the bar graph, might be the simplest and most recognizable type of visual data representation in existence. Pie charts were part of a movement away from spreadsheet-style data presentation, and the forerunners of the diverse methods of visual representation we have studied in this course. As this specific chart shows, one of the great benefits of a pie chart is in how they simply data into a fairly universally understandable image. Pie charts and their ilk are excellent tools for presenting information to viewers that would be unable to understand facts and figures on paper, and also for making plain data have a stronger impact on its viewer.

Star plot

http://www.itl.nist.gov/div898/handbook/eda/section3/starplot.htm
A star plot allows multiple variables to be compared at once, and then related to the same variables on other star plots. For example, these star plots track data points such as cost, mpg, weight, repair record, and other automobile information. Thinking of the graph as a center point with a line extending in a specific direction for each data point, each specific star plot takes on a shape that can be compared to another within the same criteria. Thus it becomes extremely easy to compare the different automobiles in this image visually.

Correlation matrix

http://www.image.ucar.edu/GSP/Projects/ResearchNuggets.shtml
A correlation matrix shows the correlation of pairs of variables. It is a useful way to compare multiple pairs of variables, and allows a cartographer to visualize several relationships efficiently. These matrices show 20 climate model biases at certain spatial locations. The columns and rows represent the different models, and the diagonal is black because that is where each model intersects with its own data.

Similarity matrix


http://www.biomedcentral.com/1471-2164/8/353/figure/F5?highres=y
A similarity matrix shows exactly what its name implies: the similarity between variable along a scale. Similarities are visualized by varying the colors of the boxes. This particular matrix is from a study on gene expression. Data pairs with significant similarity are shown in dark red, while those with no significant similarity are white, the rest are gradients between. Color visualizations like this can allow a cartographer to display complex data in a simple way.

Stem and Leaf Matrix

http://intermath.coe.uga.edu/tweb/gwin1-01/apley/Dictionary/Statistics/shape.html
Stem and leaf plots are a very simple way to organize basic data in order to see trends and averages. This plot shows the weight of children and their fathers, and shows a U-shaped curve of data. The average for the children and for the fathers is clearly visible without any mathematical legwork.

Box plot

http://edubuzz.org/blogs/nbhs3x1/2007/01/08/8-jan-2007-five-figure-summary-and-box-plots/
A box plot gives a very simple graphical summary of a set of data. Here you can see the median, average, and measures of dispersion of the annual snow depth at Mathsville Ski Resort. Typically box plots are very useful for comparing multiple sets of data in an uncluttered and easy to interprety manner, but the plot shown here only contains a single set of data.

Histogram

http://216.177.132.181/ExcelArticles/mc/Histogram.html
A histogram visualizes data by using vertical bars to show the frequency of values occuring across the horizontal axis. This particular histogram is based on a sales simulation, and could be used to determine the frequency of profit in a particular sales model. Histograms are easy to use and interpret, and good for visually representing frequency data in a more impactful way than statistics figures alone.

Parallel coordinate graph

http://informationandvisualization.de/blog/knime-interactive-views#parallel
A parallel coordinate graph can be used to analyze relationships between multiple variables, allowing the cartographer to establish correlations that would be difficult to visualize on other graph types. The difficulty, however, is that when several points of data are displayed, the lines generated can become difficult to follow when they overlap. This particular graph is of a student's grade average over a period of time.

Triangular Plot

http://www.pmel.noaa.gov/maillists/tmap/ferret_users/fu_2007/msg00384.html
A triangular plot tracks data points on three variable values. Each corner represents a maximum value. This particular triangular plot models three different potential trains of waves generated from a tsunami off the coast of Kauai. It is used to find what combinations of earthquake energy between the different potential wave sources will produce the greatest wave at an impact site. The data is plotted into ranges, and the ranges are colored to provide a clear visual representation of the data.

Windrose

http://www.maine.gov/dep/air/meteorology/Windrosehome.html
A windrose is a circular plot showing the frequency of different wind directions. This windrose, produced from a tracking site in Maine, covers a five year period of data. Since wind direction and speed are affected by topography and other geographic factors, windroses are generally site-specific graphs.

Climograph

http://www2.volstate.edu/kbell/climographs.htm
A climograph is a graphic representation of the relationship between temperature and precipitation, plotted monthly over the course of a year. Some climographs show minimum and maximum temperatures for comparison, but this graph only displays the average temperatures for Manaus, Brazil.

Population Profile

http://camellia.shc.edu/literacy/tablesversion/assignments/statisticsassign.htm
A population profile or pyramid shows age and sex distributions for a specific area at a specific time, here Mobile County in 1998. This particular image shows relatively high fertility rates and low death rates. Such graphs are useful for quickly analyzing trends in birth and mortality rates.

Scatterplot

http://www.netmba.com/statistics/plot/scatter/
A scatterplot shows the relationship between two variables by plotting data points on a two-dimensional graph. This generic scatterplot shows the basic format for a scatterplot. Notably, it lacks a trend line, which is a line used to show the average of points along a plot. Such a line is often used in lieu of the actual data points on graphs in order to simplify or hide outliers and/or weak relationships in the data.

Index Value Plot

http://www.stator-afm.com/swing-index.html
In an index value plot, data is plotted relative to an index. Here we see the change in value of the British Pound over a time period, and above that charge an index value plot where the swing of value is plotted against a 0 index, departures appearing both as positive and negative values.

Lorenz Curve

http://www.unc.edu/depts/econ/byrns_web/Economicae/Figures/Lorenz.htm
The Lorenz Curve shows how data is distributed with two variables, and can easily be compared with a perfect equality line to show the disproportionate distribution of a variable. In the case of this graph, the skewed distribution of income is clearly displayed.

Bilateral Graph

http://www.rba.gov.au/publications/bulletin/2008/feb/1.html
A bilateral graph displays two sets of related data for comparison. This particular graph is a bilateral line graph, offering the ATWI and TWI at different points in time for comparison. Here you can clearly see a correlation in trends for both lines.

Range graded proportional circle map

http://www.geog.ucsb.edu/~jeff/gis/proportional_symbols.html
This proportional circle map is range-graded, meaning the size of the circles corresponds to which value range the data point falls into. All circles within a range are of equal size, thus while the map appears cleaner than a continuously variable proportional circle map, the visual accuracy is slightly diminished.

Continuously Variable Proportional Circle Map

http://www.guardian.co.uk/news/datablog/2009/apr/13/week
This map tracks the spread of unemployment in the US between Feb. 2008 and Feb. 2009. The number of jobs lost are displayed in circles which vary in size corresponding to the data, with no range grading.

DOQQ

http://www.topographic.com/datasamples.htm
Digital Orthographic Quarter-Quads combine the characteristics of an aerial photograph with the geometric qualities of a map. Essentially, the photograph is georeferenced and orthorectified, meaning distortions caused by the point of view of the camera are removed (features of higher elevations being at higher detail, oblique angles toward objects not directly in front of the lens). This particular image is of Oklahoma.

DEM

http://www.humboldt.edu/geology/courses/geology350/350_maps_airphotos.html
This digital elevation model (DEM) is made from a digital file containing terrain elevations from ground positions at regularly spaced horizontal intervals. Here the data has been used to generate a three-dimensional image with variations in color to bring out relief.

DLG

http://barthelmy.com/consulting/projects/proj_custom_data_MidContinent.htm
This DLG (Digital Line Graph) is made with digital vector data and shows a lot of useful information about the landscape. This particular DLG map shows public land section lines, hydrographic features, roads/railroads, and topographic contour lines.

DRG

http://www.forestpal.com/DRGs.html
The digital raster graphic, or DRG, is a digitally scanned and georectified USGS topoquad. It contains geogeographic coordinates and is tied to a datum and projection. This particular map came without a description, but appears to include contouring information on the landscape, and makes note of particular natural formations in the landscape.

Isopleths

http://www.stonelions.com/Jacksonville.htm
Isopleths are lines connecting points of equal value on a map. This map uses isopleth lines to show the air dispersion of toxic chemicals averaged over a five year period (1961-1965). The isopleths provide a very clean method of showing this type of data, allowing the underlying landscape to remain clearly visible, and the impacted area to be clearly defined.

Isopachs

http://www.geo.utexas.edu/faculty/barker/kempter/rbtephra.html
Isopachs are lines that connect points of equal thickness in a geological formation. This map is of the Rio Blanco tephra deposit, created by a volcanic eruption in Costa Rica. It uses a color scale to make the data easier to visually interpret.

Isohyets

http://www.bbc.co.uk/blogs/weather/ianfergusson/2010/06/formula-one-weather-forecast-c-1.shtml
Isohyets are lines on a weathermap connecting points of equal rainfall. This map (similar to the one in the notes but not the same) shows predicted rainfall across the United States.

Isotachs

http://www4.ncsu.edu/~nwsfo/storage/cases/20030123/ Isotachs are isolines connecting points of equal wind speed, as shown in this map of a winter storm in 2003.

Isobars


http://www.weatheronline.co.uk/reports/wxfacts/Isobars-on-surface-maps.htm
Isobars are lines connecting points of equal pressure. The pressure readings are reduced to sea level to account for the different heights of pressure reporting stations. The tightly grouped set of lines on this map indicates a strong low-pressure system, which indicates also the point where winds are the strongest.

Cadastral map


http://www.icsm.gov.au/mapping/maps_cadastral.html
This cadastral map defines the boundaries between parcels of land in order to show land ownership. It is notable that very little other information is included in the map, as seen here only major roads and waterways are visible. Information on the owners of individual plots, along with identification numbers, are also included.

PLSS map of Minnesota

http://www.fairview-industries.com/standardmodule/mn-exmpl.htm
This map portrays the divisions of the Public Land Survey System in a section of Minnesota. Here you can see the divisions by Township and Range. This map is also divided by quarter section, and quarter quarter section, as indicated by the first and second number respectively within each division.

Hypsometric color map of Goiania

http://www.earthexplorer.com/2009-03/Subsurface_Geology_Challenges_Goiania_Metro.asp This hypsometric topographical map uses color and shape to indicate variations in height, thereby detailing three-dimensional information in a manner beyond mere contour lines (which are included) and raised relief. The key to this map is exceptionally informative, showing direction, scale, and a clear gradient for interpreting elevation by color.

Raised Relief Map of Russia


http://www.testplay.ru/en/hrrp/ofm/hrrp-ofm-rusm.html
This raised relief map of Russia is a type of hypsometric map, communicating three-dimensional information. It is interesting how the site describes the map: "It depicts the spirit of vast and mighty Russian territory; shows the dynamics of life and business activities." This hints toward why a cartographer might choose the raised relief type of map, which seems like a relatively fragile method of showing the actual landscape. Here the entire purpose is effect, rather than functionality.

LIDAR animation of Mt. St. Helens crater floor

http://vulcan.wr.usgs.gov/Volcanoes/MSH/Eruption04/Monitoring/eruption_monitoring_oct-nov_2004.html
This animated series of LIDAR images shows changes in the crater floor of Mt. St. Helens during the 2004 eruption. LIDAR uses laser (i.e. light) to determine distances, compositing into an image, as opposed to doppler or sonar, which use microwave and sound, respectively.

Doppler image of hurricane Dolly

http://www.foxnews.com/story/0,2933,388164,00.html This doppler radar image of Hurricane Dolly as it hit Texas was made by pulsing microwave radiation and measuring the time of arrival of the pulses.

Aerial Black and White Photo of Lyttleton Harbor

http://rst.gsfc.nasa.gov/Sect10/Sect10_1.html
This black and white aerial photography of Lyttleton Harbor in New Zealand shows approximately the same wavelengths that the human eye would pick up. The angle of this one is interesting, defined as high oblique by the website it was taken from, as it functions just as the human eye might, with great detail close to the camera and a less defined landscape in the background. It provides an interesting contrast to the top-down aerial photographs I have found, which show a relatively constant resolution for the entire photo.

Infrared Aerial Photo of Susquehanna Water Gap


http://rst.gsfc.nasa.gov/Sect10/Sect10_1.html
This infrared aerial photograph is at a 1:8000 scale, and shows the Susquehanna Water Gap. Infrared photography makes the land and water contrasts much more distinguishable than a typical black and white photograph, and here you can see how distinct the infrared emulsion makes the waterway.

Cartographic Animation of Sensible Heat Flux


http://uwacadweb.uwyo.edu/JSHINKER/animations/global/
This cartographic animation shows fluctuations in sensible heat across the globe. This type of map shows statistical information over a period of time, allowing for a more dynamic visual representation of interval changes in a map.

Cartogram of the World Economy

http://maps.grida.no/go/graphic/world_economy_cartogram This cartogram distorts the actual area of world countries in order to reshape them into a size corresponding to their Gross Domestic Product per capita. It provides an interesting contrast to standard maps of the world because it allows the cartographer to portray the power/status of individual nations visually without being constrained by the actual size of the nations, thus making the data more impactful.

Propaganda Map

http://longstreet.typepad.com/thesciencebookstore/2008/08/propaganda-maps.html
This propaganda map was created by Nazi Germany in order to give the population of Germany a false impression of Czechoslovakia's air-strike capabilities. It attempts to show the radial distance of the Czechoslovakian air force shrouding nearly the entirety of Germany. Interesting here is also the use of color, with the map almost implying that the planes will cover the country in darkness.

Isoline Map of Annual Runoff Depth of East China Water Transfer Region

http://unu.edu/unupress/unupbooks/80157e/80157E09.htm
This isoline map shows the annual runoff depth of the East China water transfer region. An isoline map shows regions containing continuous points of equal value by connecting them with lines.

Flow Map of Napoleon's invasion of Russia

http://hci.stanford.edu/jheer/files/zoo/ This flow map is a type of line pattern map, showing the actual path of Napoleons troops as they invaded Russia (red line), and retreated (black line). It very clearly shows with the shrinking width of the line the rapid decline in numbers that Napoleon's army underwent.

Proportional Circle map of Mexican Population in the Western United States


http://www.neiu.edu/~ejhowens/377/examples.htm
This point pattern map displays data with a circle, which varies in size based on the population. The size relates to the population of the state, which makes it a bit less informative compared to a dot distribution map, which would give more information regarding the spread of the population over the area.

Choropleth map of China's population density


http://www.bestcountryreports.com/Population_Map_China.html
The resolution of this jpeg makes it hard to tell, but it appears to be a classed choropleth map showing population density. I can't tell what the areal unit is, but it looks like there are six classification intervals.

US Census Dot Distribution Map of 2000 Population

http://www.census.gov/geo/www/mapGallery/2kpopden.html
This thematic map is a dot distribution map of the 2000 US population made by the US Census. The thematic map is made by showing information superimposed over a base map of the United States, and that information is translated into dots, each dot indicating 1000 citizens.

Topographic map of Egypt

http://www.loc.gov/rr/geogmap/guide/gmillcon.html This 1:25,000 scale topographic map of Egypt has contour lines that portray the shape and elevation of the land, along with indications of what appear to be buildings and roads. It also has what appears to be a railroad, and some sort of marking lines to denote perhaps a territorial division.

Saturday, December 4, 2010

Planimetric map of China

http://www.loc.gov/rr/geogmap/guide/gmillcon.html This planimetric map of China is a surface map that lacks relief features. It appears to be a section of a larger, gridded map, and indicates what look like roads and maybe a railroad, possibly bodies of water, and divisions of the landscape (these could be territories, property lines, or something else entirely). Without being able to understand the language, it is hard to tell what the shaded sections are.

Mental Map

http://www.fedstats.gov/kids/mapstats/concepts_mentalmaps.html This mental map is an abstracted representation of the world as it was perceived by its cartographer. It is notable for the large areas of white space, omissions by the mapmaker that were probably regarded as irrelevant to the purpose they intended the map to serve.